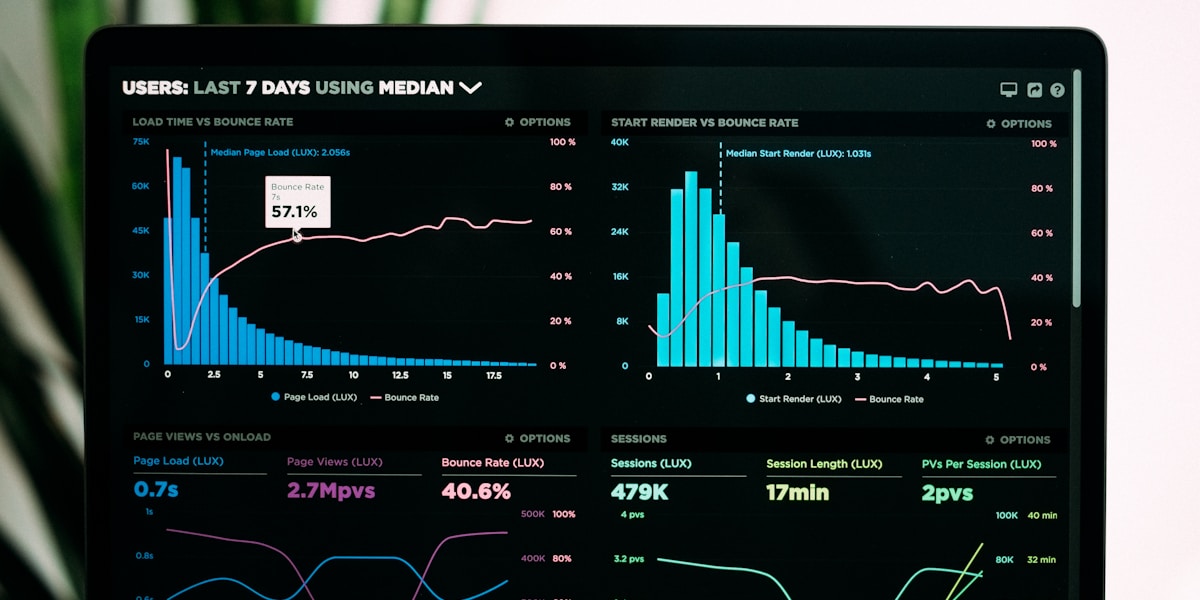
Find Bottlenecks Fast
Core System Performance Analysis Guide
Keynodex Marketing Team
Marketing Team

Overview
Make your systems feel fast and stay fast. This playbook focuses on the small set of metrics and practices that move the needle.
North‑Star Metrics
- Time to first byte (TTFB) - p95 latency per critical endpoint - Error rate and saturation (CPU/memory/IO)
Diagnose First, Then Tune
- Establish a baseline: capture 7 days of logs, traces, and metrics. 2) Map the slow path: which calls dominate latency? follow the trace. 3) Find the constraint: database, network, compute, or code hot spots.
High‑Leverage Fixes
- Cache the expensive 20% (with SLAs and invalidation rules) - Add indexes for slow queries; avoid N+1s - Use back‑pressure, timeouts, and retries explicitly - Profile before optimizing code paths
Quick Checklist
- p95 < 300ms on critical APIs - [ ] No 5xx spikes under load - [ ] Dashboards for latency, errors, saturation - [ ] Load test per release for key journeys
Conclusion
Performance is a habit. Measure, improve, repeat. If you want help prioritizing fixes that deliver real user impact, talk to Keynodex: https://keynodex.com/?utm_source=blog&utm_medium=referral&utm_campaign=core-system-performance-analysis-guide
About Keynodex Marketing Team
The Keynodex Marketing Team creates technical content, industry insights, and best practices guides to help developers and businesses build better software systems.
View all posts →Try KeynodeCard
Share your professional profile instantly with a single scan. No app required.
Related Articles
 Architecture
OAuth2 + JWT: Secure API Auth
OAuth 2.0 and JWT: Building Secure API Authentication Systems
 Architecture
GDPR for Developers: A No-Drama Compliance Guide
GDPR Compliance for Software Applications: A Developer's Guide
 Architecture
Zero Trust Done Right
Zero Trust Security Architecture Implementation: A Practical Guide